For seed-stage SaaS teams
Your servers, read for you, with the command to run.
Opservo is the AI ops engineer for product teams running 5 to 20 Linux servers with no SRE. One command per server, and your app, worker, database and cache boxes get a 0–100 health score, a plain-English explanation of what is wrong, and the exact fix, approved by you.
The seed-stage problem
Nobody’s title is SRE, and the most senior engineer carries the pager.
A team of 3 to 25 people ships product all day and runs its own stack at night: app servers, workers, a database, a cache, on AWS, Hetzner, DigitalOcean or Fly. Incidents land after hours and the person on call has to reconstruct what changed. Logs are spread across nginx, the app, Docker and systemd, and nobody has time to centralise them. Hardening, certificates and disks keep slipping behind the roadmap. And the Datadog or New Relic quote was a shock at exactly the size where the free tier ran out.
| What goes wrong | What Opservo tells you |
|---|---|
| A 2 a.m. incident nobody can explain the next morning. | An incident timeline that correlates alerts, log errors, deploys and package or config changes into one chain, with the root cause named. |
| “Why is checkout slow?” means an hour of SSH and htop. | AI chat grounded in your servers’ own data: which process, query or disk is responsible, and the command that fixes it. |
| An expired certificate or a full disk took the product down. | Every vhost’s SSL expiry is found on its own; disks and inodes get a fill forecast, not just a threshold. |
| The monitoring bill grows with traffic and log volume. | Flat per-server pricing. Log volume, seats and features never change the number. |
| An enterprise prospect asks what you use for monitoring and security. | A security score per server, and SOC 2, PCI-DSS and HIPAA evidence built from the same facts, on the Growth plan. |
It explains, in plain English.
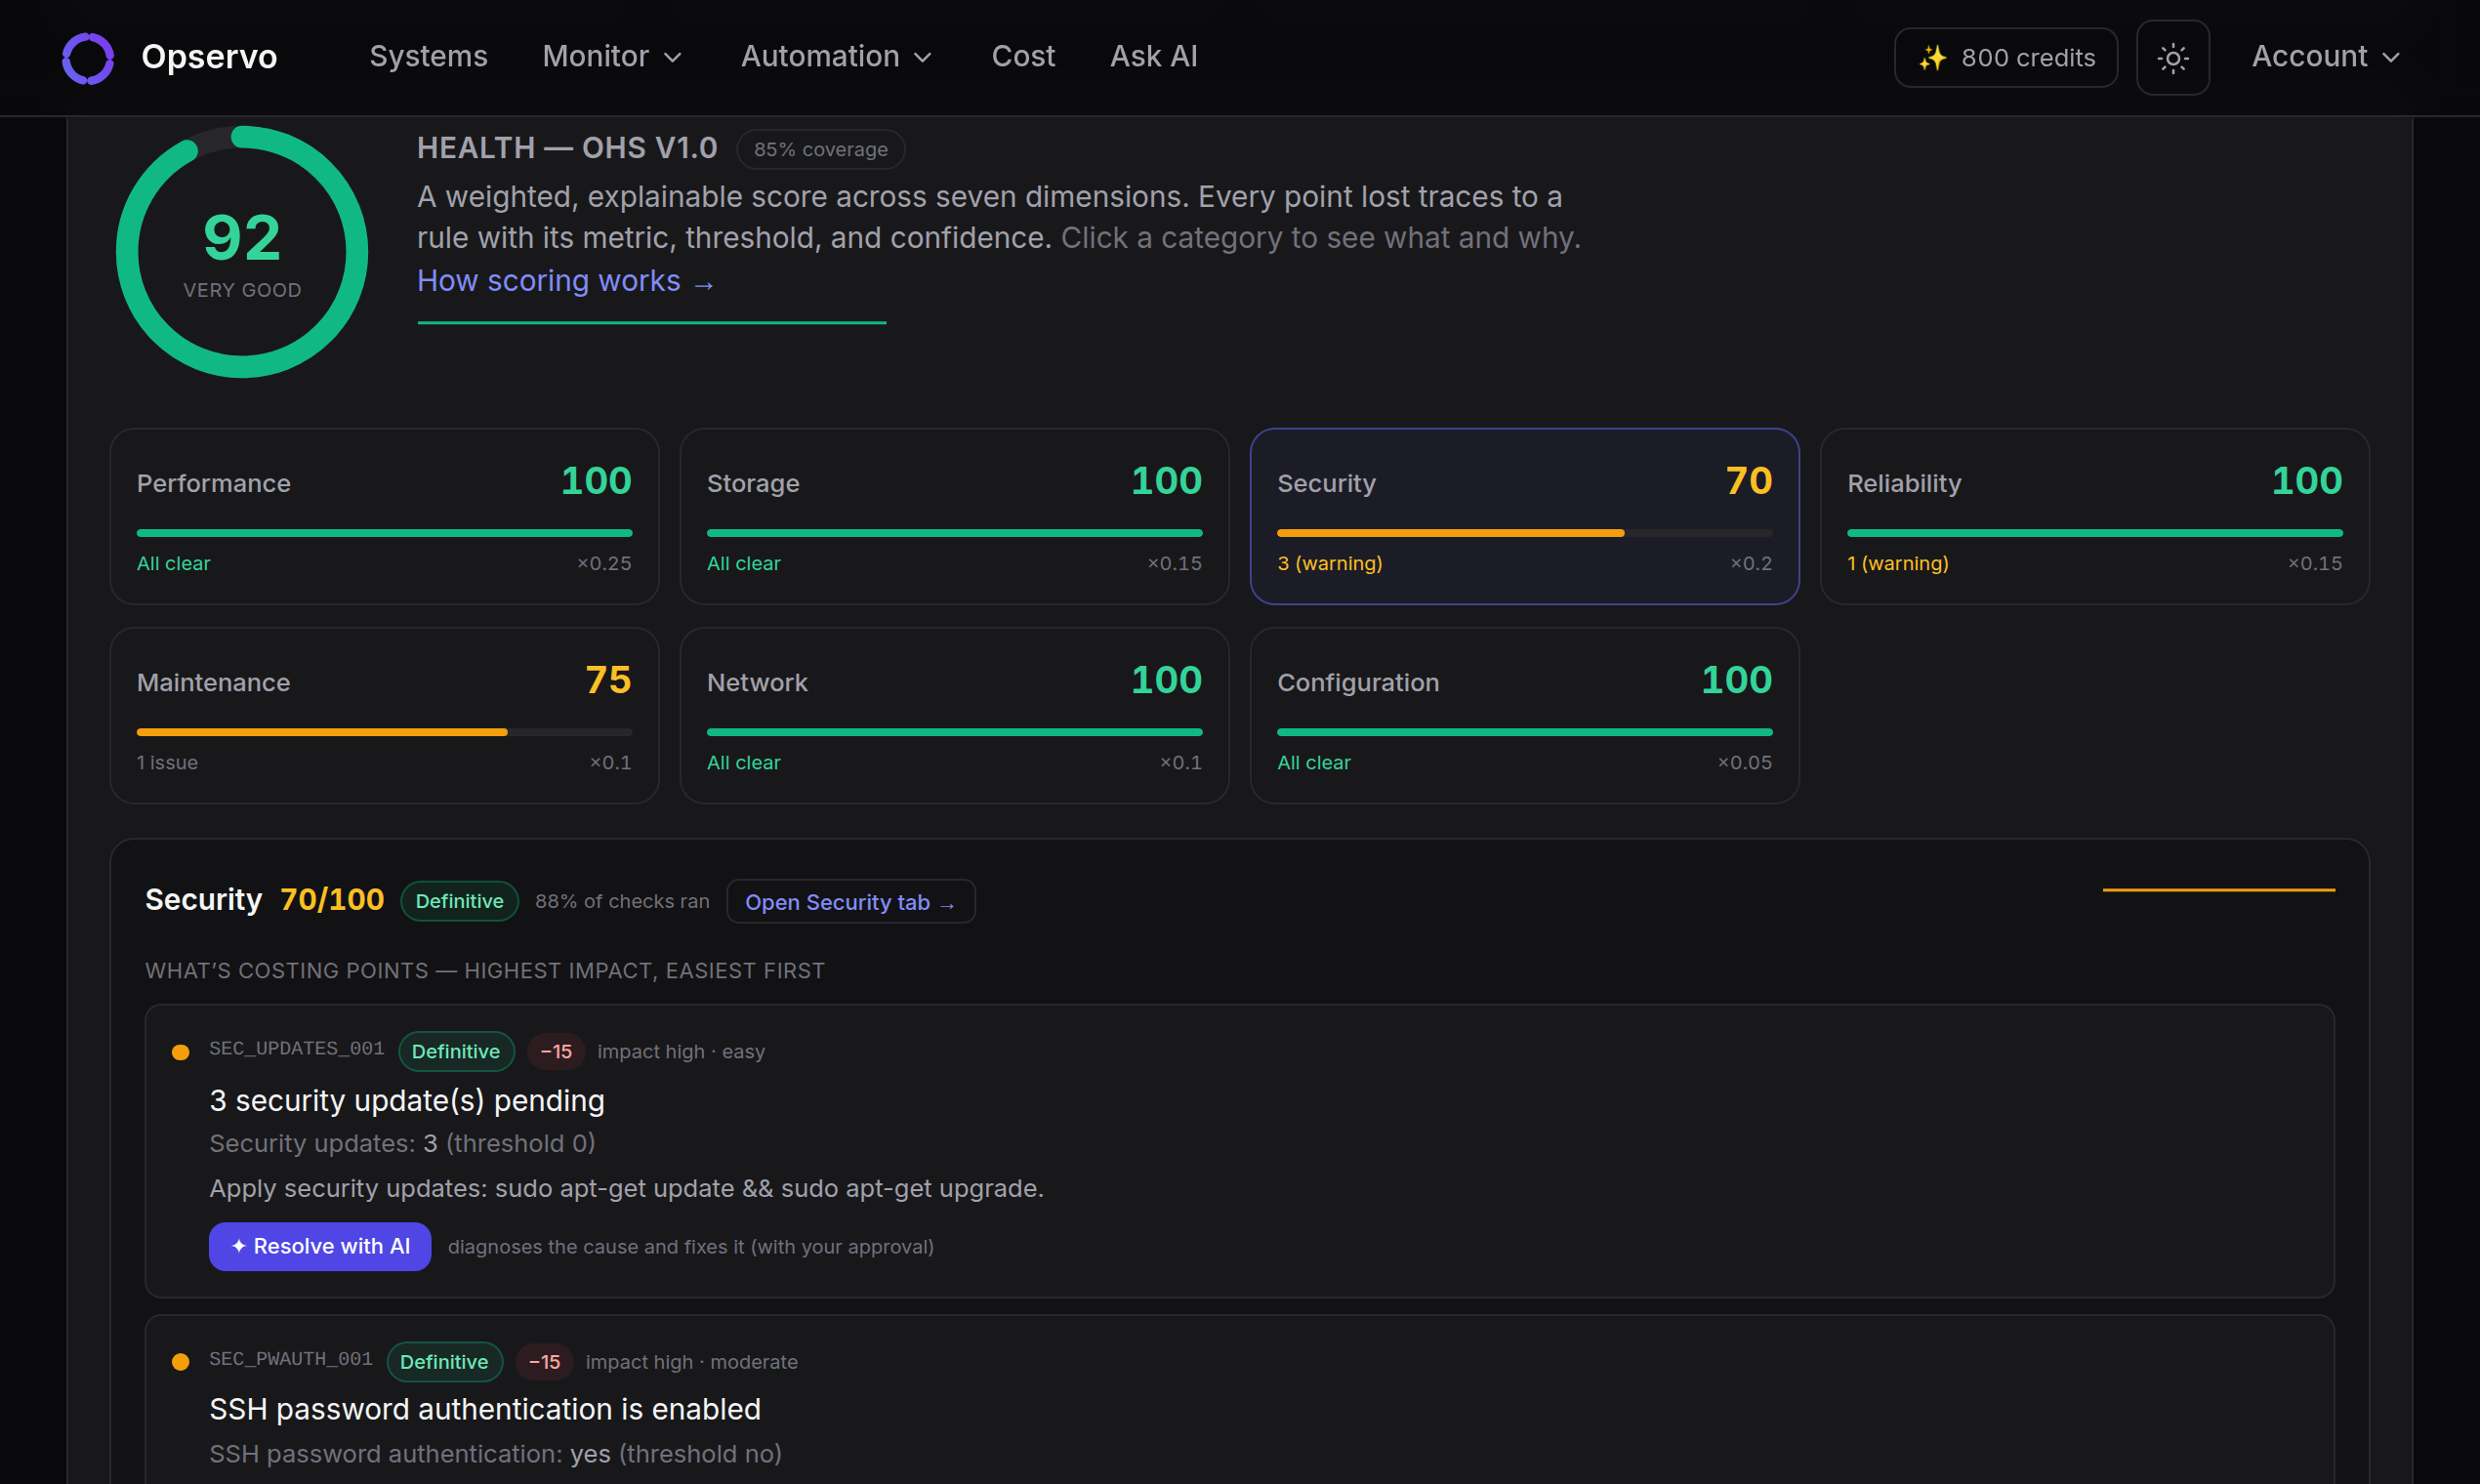
Not a graph. “MySQL is slow because the disk is 94% full and the slow log is on.” Every lost health point names the rule, the threshold, the current value and the fix, so the engineer on rota acts instead of reading dashboards.
It fixes, with your approval.
One click runs the fix. Every run is Ed25519-signed and recorded with its output, and remote actions stay off until an owner turns them on for a server. The AI can propose and run a fix inside the same guardrails.
No configuration, first value in minutes.
One command installs the agent. It finds every service, container, port, domain and log on its own, and the first finding arrives in under five minutes.
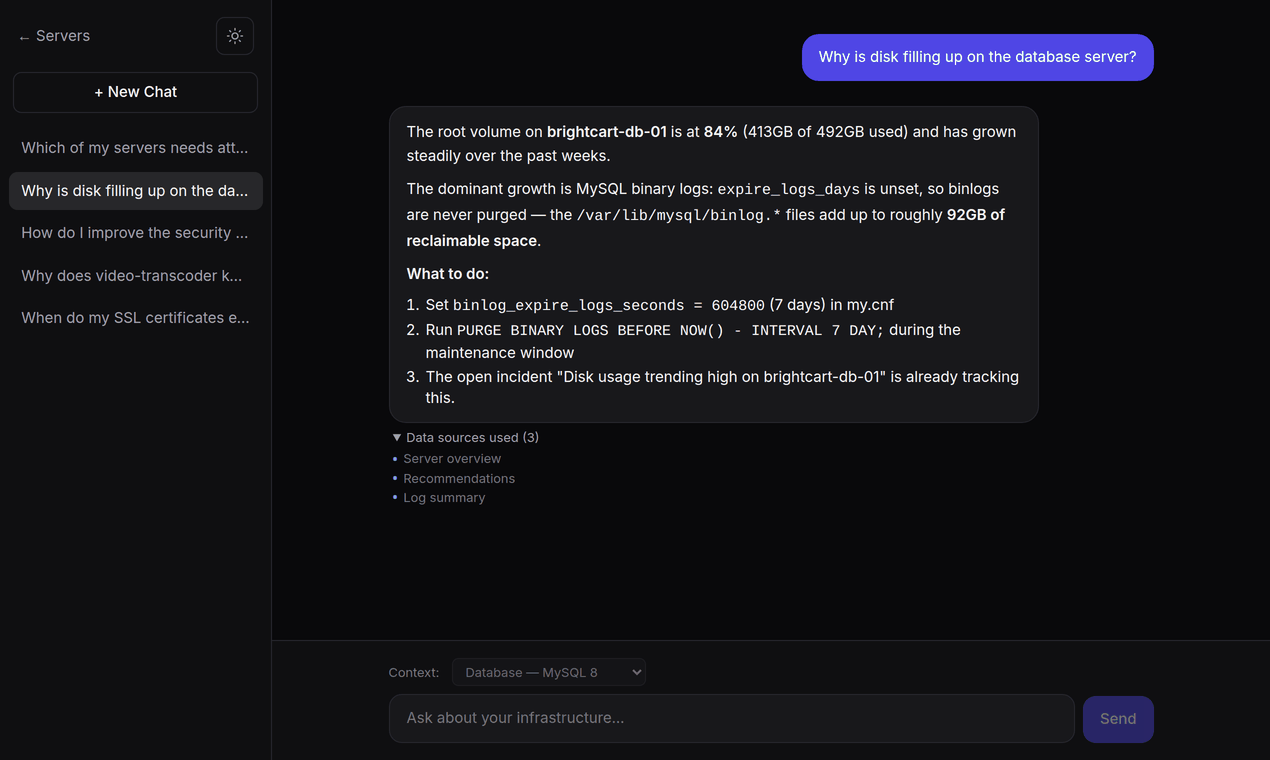
What the agent finds on a typical SaaS server, with no configuration
systemd services, Docker containers, PM2 apps, nginx and Apache vhosts with their SSL expiry, open ports, MySQL, PostgreSQL and Redis with their slow queries and config facts, and Node, Django, FastAPI, Laravel, PHP and WordPress applications. Logs from nginx, the app, Docker, PM2 and systemd are clustered and summarised in plain English, and raw lines are never stored. Add external uptime checks, cron heartbeats, on-call rotations with SMS, WhatsApp and voice paging through your own Twilio, incident management and a public status page, in the same place.
Running Laravel? See how Opservo watches a Laravel server. A small Kubernetes cluster next to the VMs? A separate read-only agent reports the whole cluster from one Deployment.
Fits the tools you already use
Alerts where the team already is, data where it already lives.
- Alerts: Slack, Discord, Telegram, email and webhooks, plus PagerDuty and OpsGenie, with a green “Resolved” notice when the issue clears.
- Metrics: a Prometheus endpoint for every server and the fleet, and a Grafana data source if the team already has dashboards.
- AI tools: a read-only MCP server so Claude, Cursor or VS Code can ask about your servers. How to connect it.
- Open source agent: the Linux agent is published at github.com/getopservo, so the engineer who reads the source can see exactly what leaves the box.
Safe on production
Read-only until you say otherwise.
- The agent is read-only by default and opens no inbound ports. It talks outbound over HTTPS, and every message is HMAC-signed.
- Agent updates and remote commands are Ed25519-signed.
- Remote actions and AI fixes are opt-in per server, and every one is audited. A fleet update never turns them on, and the box keeps a local kill-switch.
- Raw logs are never stored; Opservo keeps the clusters, not the lines.
- The agent never reads application .env files or secrets from disk.
Pricing for SaaS teams
Growth plan: ₹999 per server per month (about $12). Billed in INR, no server cap, no per-seat pricing, and nothing in the bill moves with log volume or traffic. Includes one-click and AI fixes, fleet runs and schedules, compliance evidence, on-call, uptime checks and custom dashboards. Annual prepay is the only discount. Start on the free plan with 2 servers and no card, and move up when the first fix has earned it.
Already running something?
- Sentry: keep it. Sentry owns code-level errors and traces; Opservo is the server layer underneath. We do not do APM.
- Datadog or New Relic: if someone reads the dashboards every day and the per-host and per-feature bill fits, keep it. If the person on rota is a developer, Opservo reads the server for you, at one flat number.
- UptimeRobot, Better Stack, Uptime Kuma: they tell you the site is down. Opservo tells you why, and what to run, from inside the box.
- Netdata or a Grafana someone set up once: the best per-second chart per node. Opservo gives one ranked view across the fleet and the fix, and exports to Grafana if you want both.
Full comparisons, including where the other tools win: /compare
Put it on the server that paged you last.
One command, about 30 seconds, first insight in under 5 minutes.
$ curl -sSL https://api.getopservo.com/install.sh | sudo bashQuestions: hello@getopservo.com