For agencies and MSPs
Every client server, one ranked list, and the fix.
Opservo is the AI ops engineer for agencies without an SRE. One command per server, and every client’s Laravel, WordPress and Node boxes get a 0–100 health score, plain-English explanations and one-click fixes you approve.
Shanky runs Softuvo’s own client fleet on Opservo. The call ends with a date for a 20-minute screen-share install on your first 10 servers.
The agency problem
Thirty servers, ten clients, and one person who knows where everything is.
Most agencies host client sites on a handful of Linux servers each, and the person who gets the 2 a.m. call is a developer, not an SRE. The client notices the outage before you do. The disk that filled up overnight was filling for weeks. And when the one person who knew the servers leaves, so does the map.
One fleet view, ranked by health.
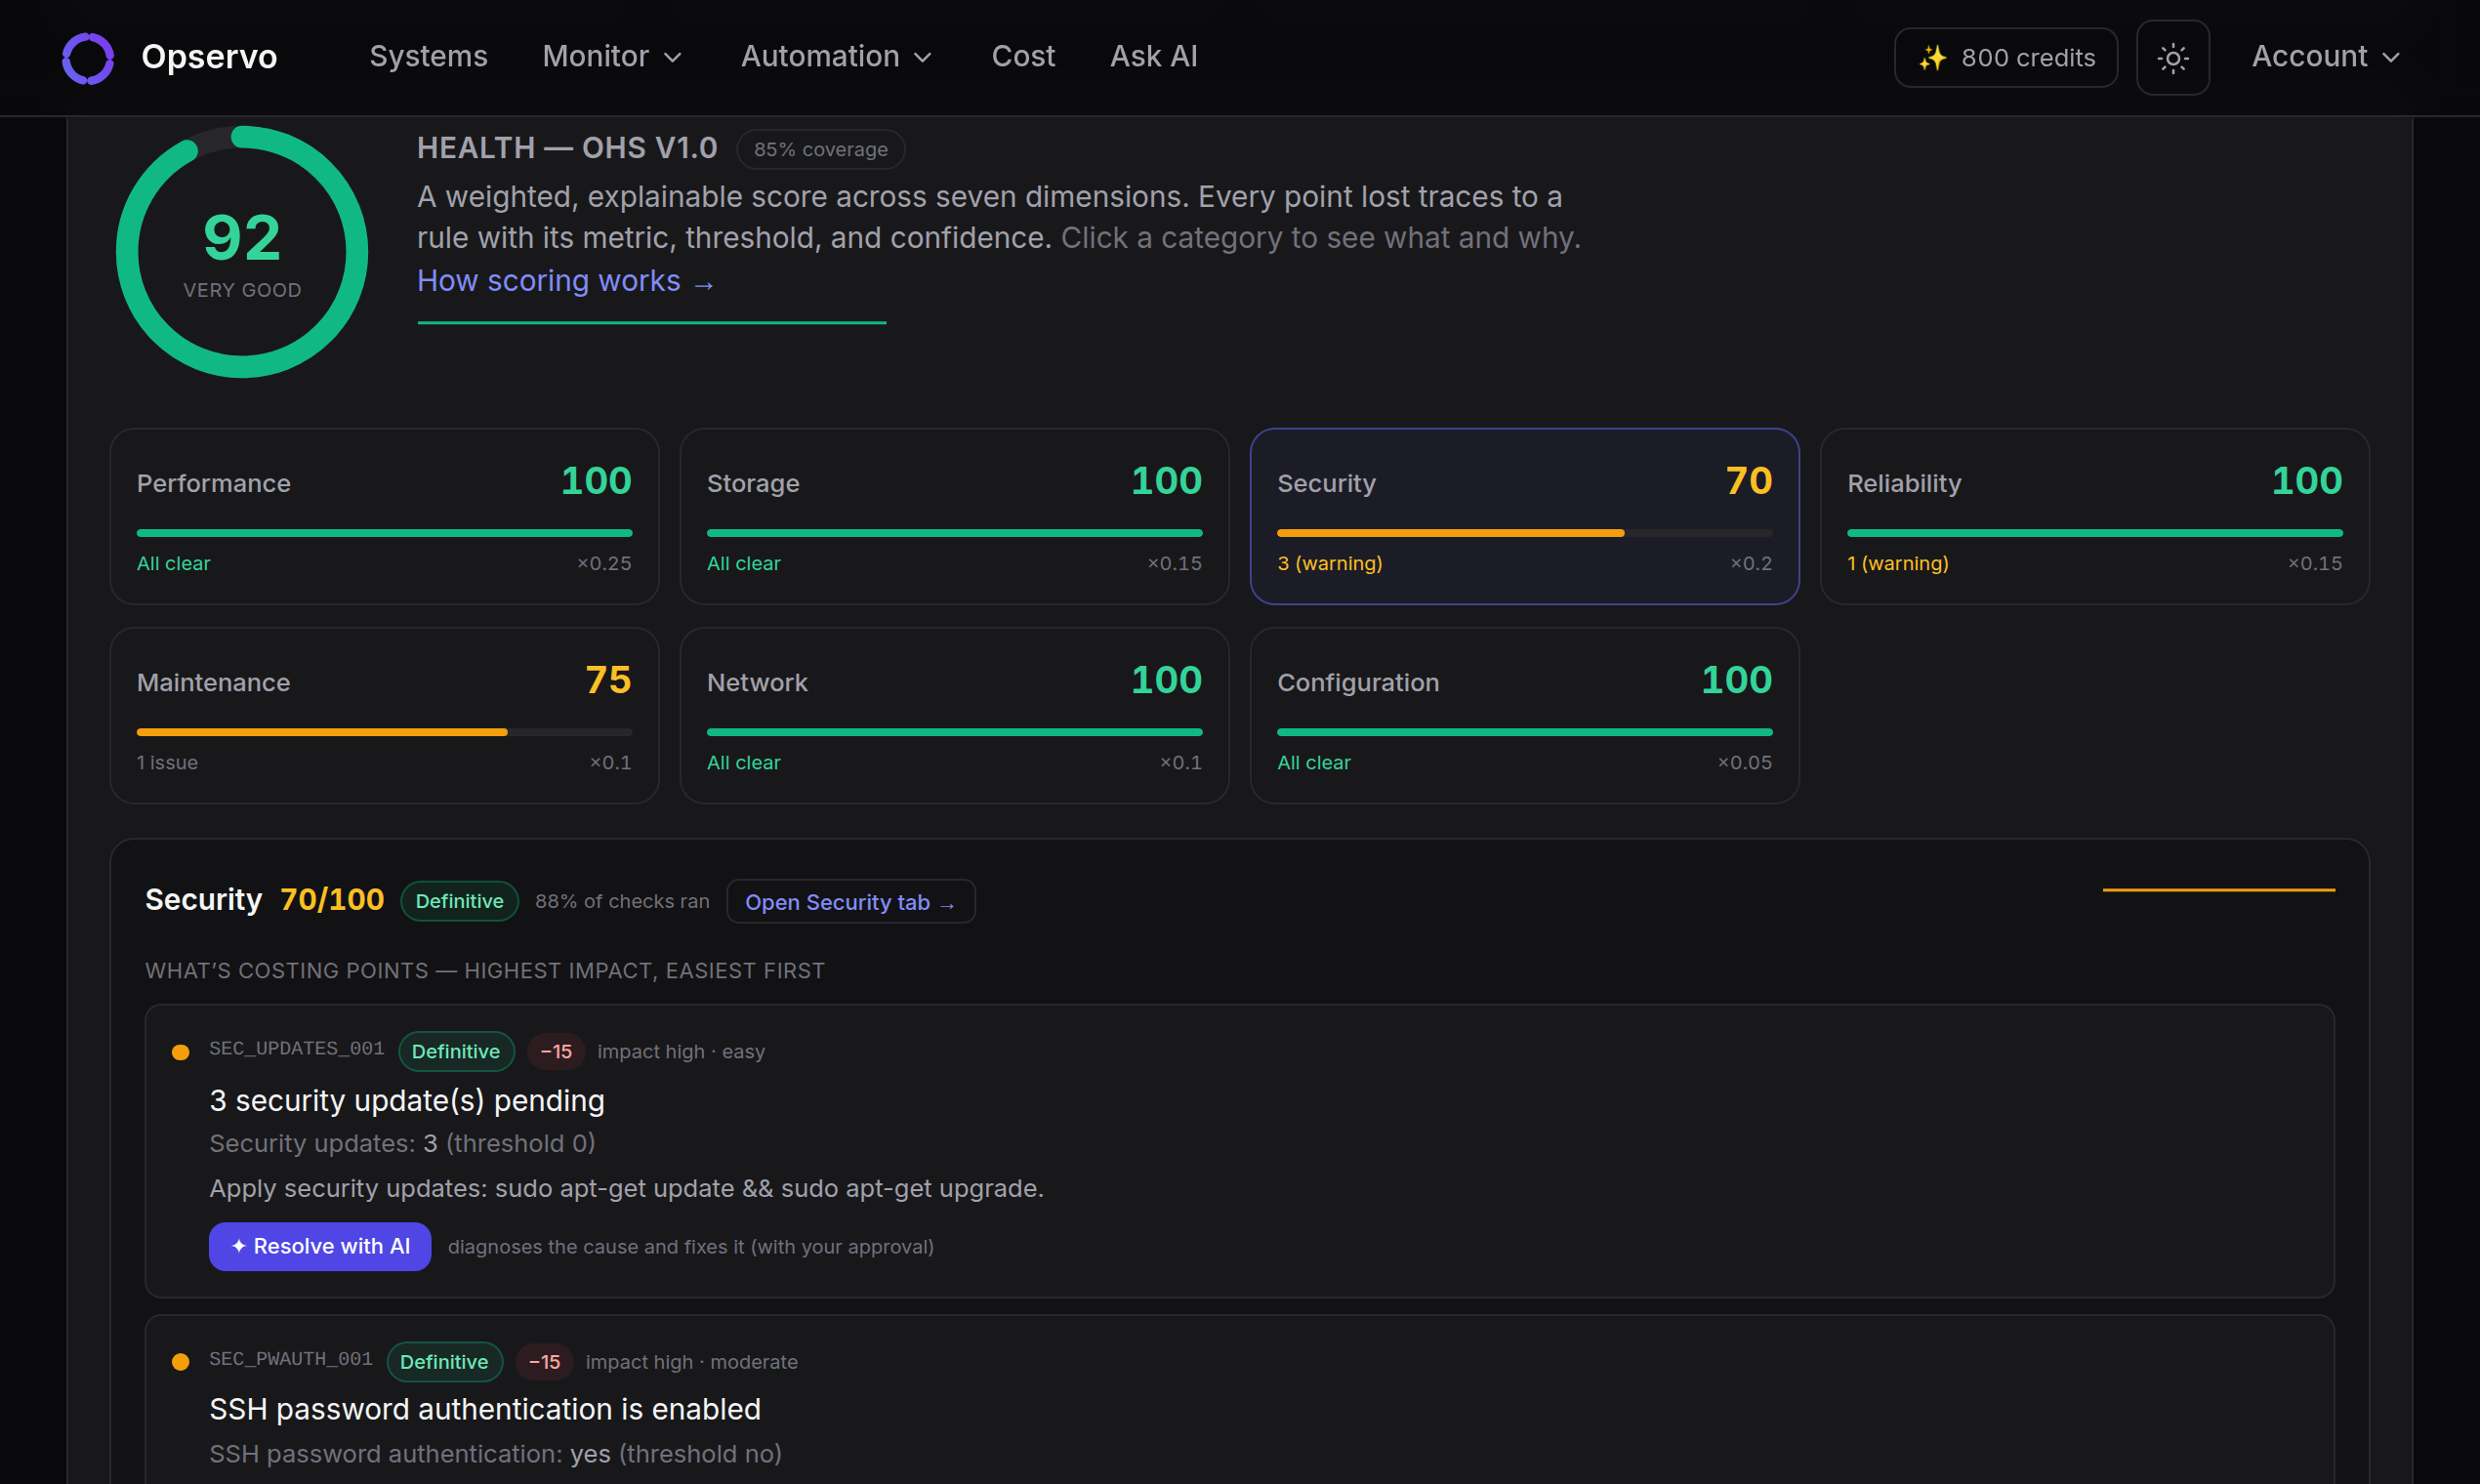
The Opservo Health Standard scores every server 0–100 across performance, security, storage, reliability, maintenance, network and configuration. Every lost point names the rule, the threshold, the current value and the fix, so you start the week with the worst server, not the loudest alert.
Problems explained in a sentence.
What is wrong, what changed, what to do. Opservo forecasts disk-fills and error spikes before they reach the client, and when the fix is known you apply it with one click or a pre-approved policy.
Each client kept separate.
Multi-tenant workspaces keep every client’s servers, alerts and people apart. White-label means each client’s public status page shows their logo with no Opservo branding, and SLA reports export as a PDF under that client’s workspace name.
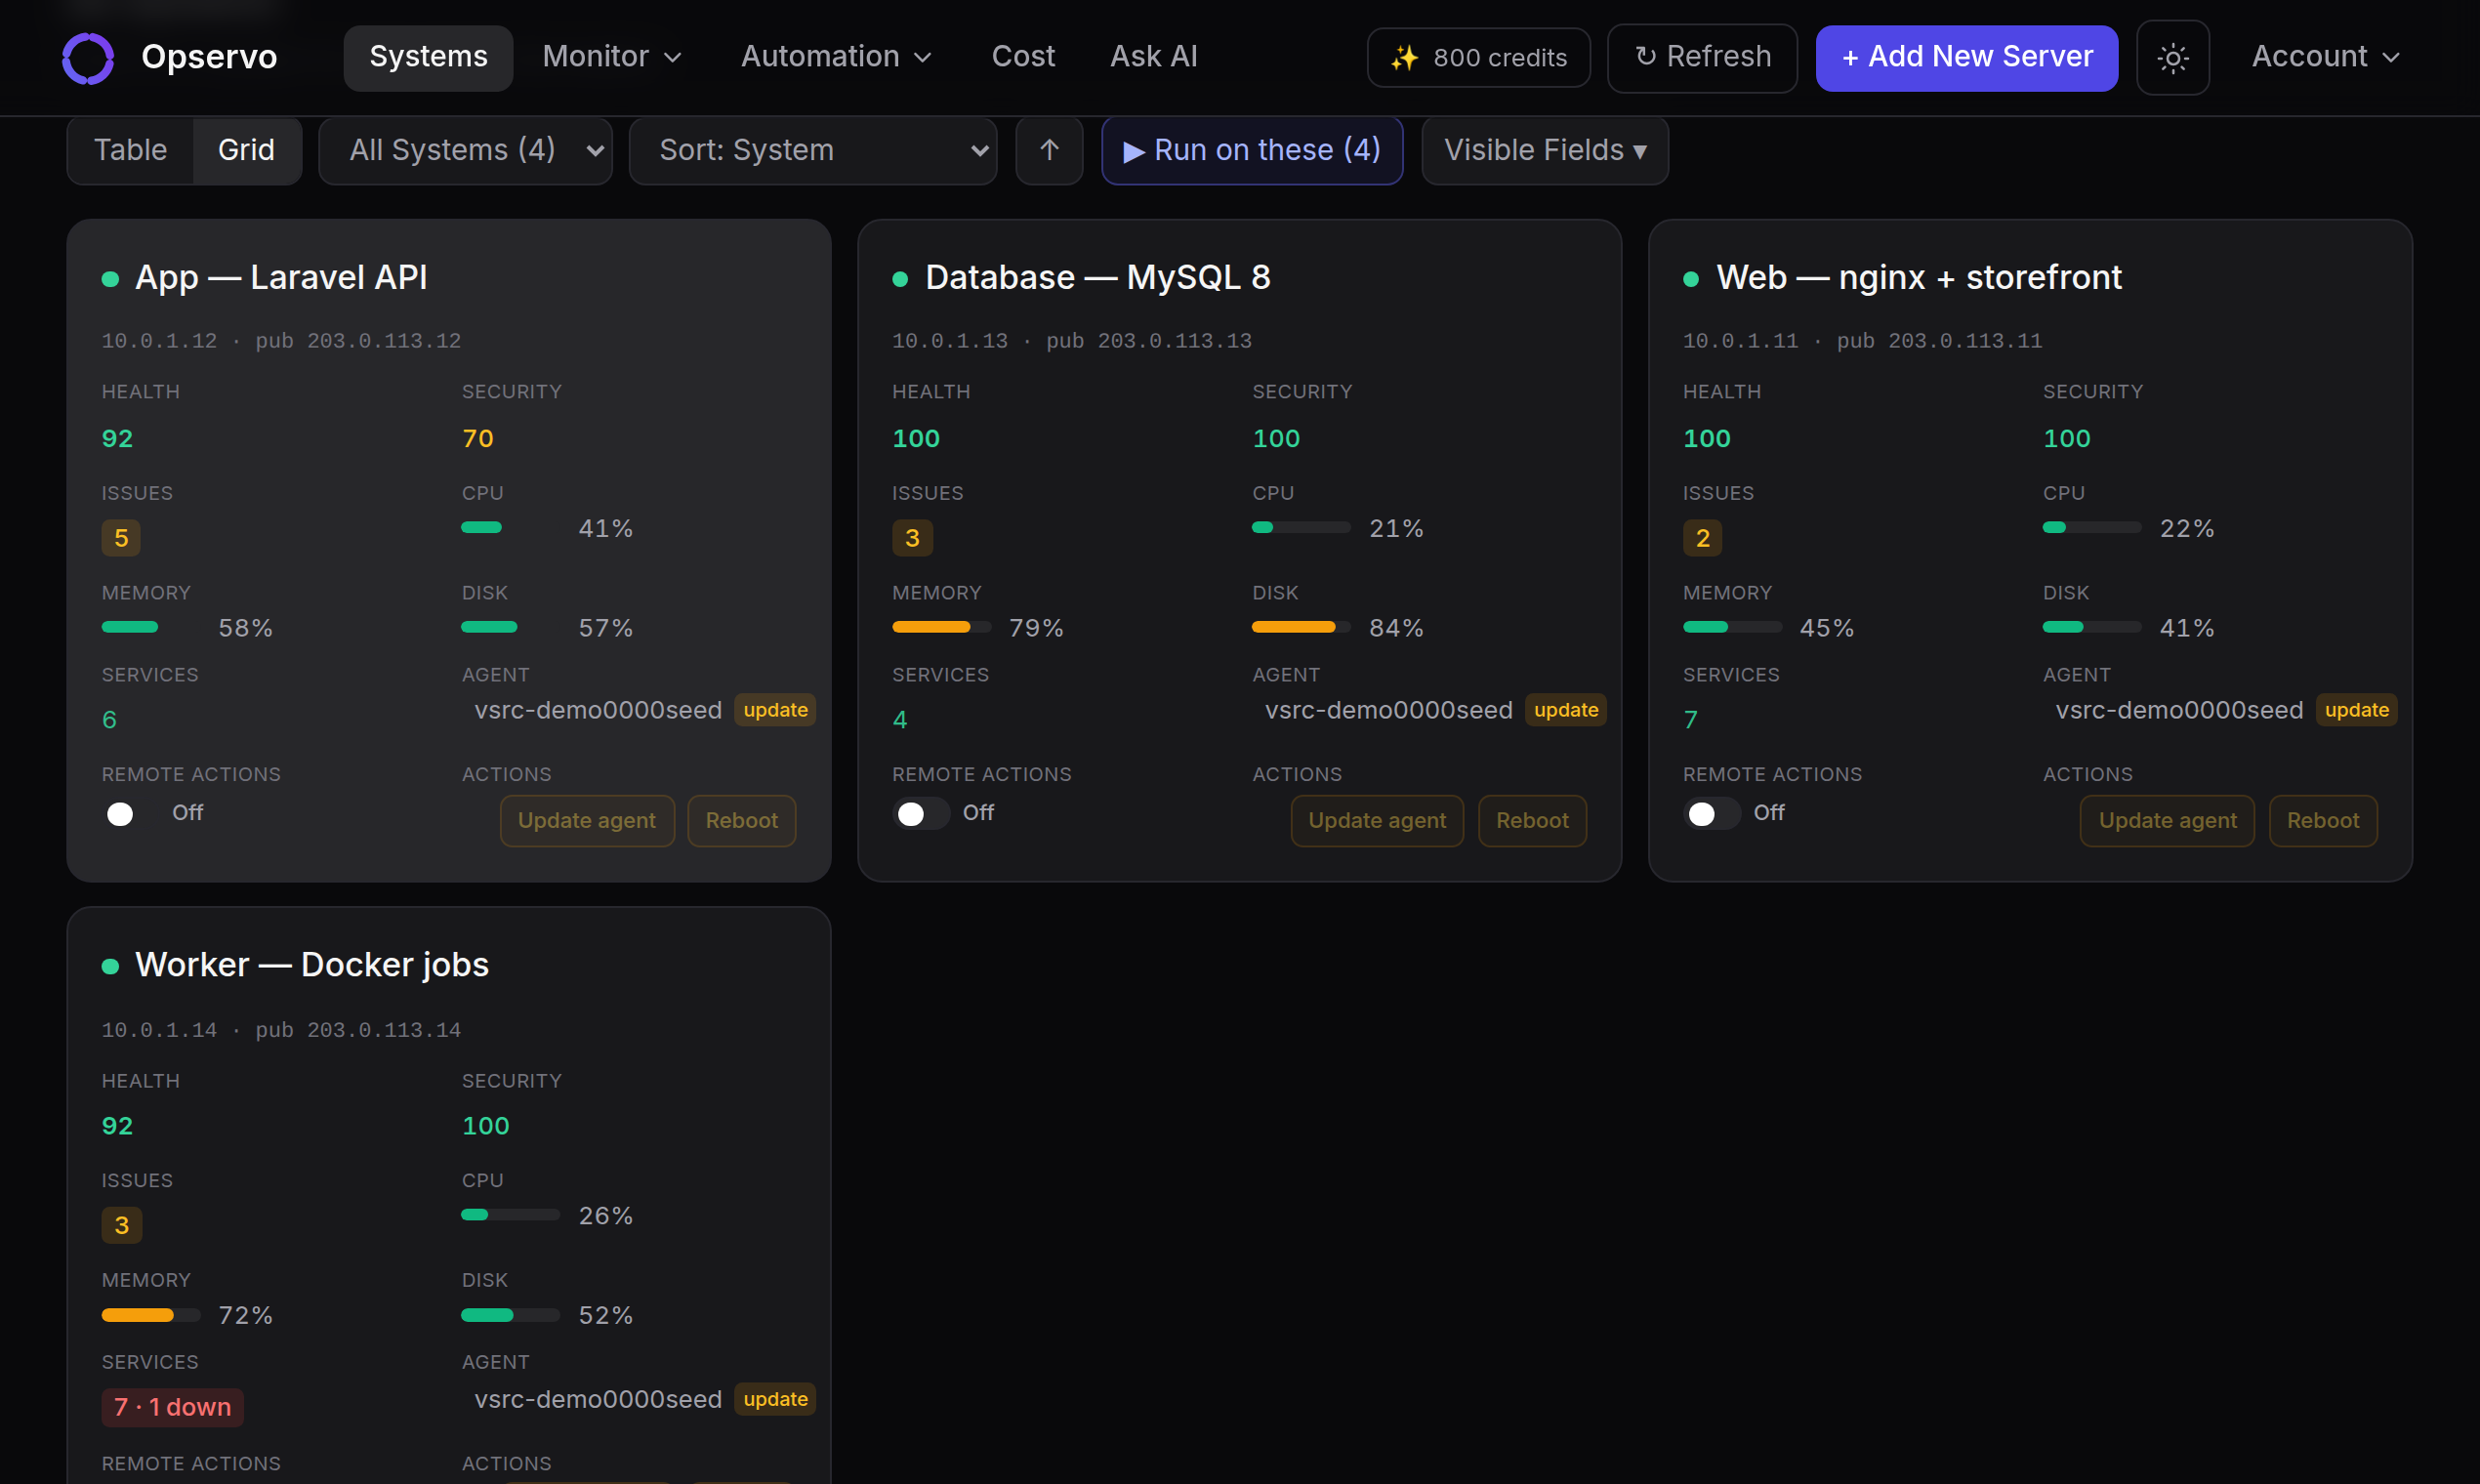
What it finds on a typical agency server
The agent auto-discovers, with no configuration: systemd services, Docker containers, PM2 apps, nginx and Apache vhosts with their SSL expiry, open ports, MySQL, PostgreSQL and Redis, and Laravel, WordPress, Node, Django, FastAPI and PHP applications. Add external uptime checks, cron heartbeats, on-call rotations with SMS, WhatsApp and voice paging (your own Twilio), incident management and public status pages, all in the same place.
Hosting WordPress for clients? See how Opservo watches a WordPress server. Running servers as a managed service? See the MSP page.
Clients in online learning, travel and booking
Agencies often run servers for learning platforms and booking portals, where the bad moments are predictable: exam day, results day, a sale, a holiday weekend, or a booking engine that goes down at night. The same tools apply. Disk-fill and error-spike forecasts warn you before the busy day, external uptime checks and on-call paging make sure someone answers at 2 a.m., and each client gets a public status page with their own logo.
Safe on client servers
Read-only until you say otherwise.
- The agent is read-only by default and opens no inbound ports. It talks outbound over HTTPS, and every message is HMAC-signed.
- Agent updates and remote commands are Ed25519-signed.
- Remote actions and AI fixes are opt-in per server, and every one is audited. A fleet update never turns them on.
- Raw logs are never stored; Opservo keeps the clusters, not the lines.
Proof from our own fleet
We run it on our own client fleet first.
Softuvo is an agency too. Softuvo runs production for 18 companies, its own products and the clients it manages (Laravel, Node, Docker, nginx and MySQL, on AWS and on-premise), and every one of them is on Opservo. Every name reports to Opservo today: Novoxpress, Enterprise Management Systems, HEE Solution, The Lottery Lab and more are managed by Softuvo on Opservo. Enterprise Management Systems: one server, about 45 brand sites, one agent. Novoxpress: 7 AWS servers in Canada, managed by Softuvo on Opservo. It has also caught us out: from 31 July to 28 September our own Discord webhook rejected every alert with an HTTP 400, including through an 8-day Redis outage. We fixed it, and now every notification channel shows the result of its last delivery, so a silent channel is visible the same day.
Pricing for agencies
Agency plan: ₹799 per server per month (about $9.50), 10-server minimum (₹7,990 a month, about $95), or ₹7,990 per server per year. Billed in INR. Includes multi-tenant workspaces, white-label status pages, priority support and 250 AI credits per server. Start on the free plan with 2 servers and no card, and move up when the rest of the fleet joins.
Already running something?
- Datadog: if an SRE reads it every day, keep it. Opservo runs beside it at a flat per-server price.
- Netdata: the best per-second chart per node. At 15 servers that is 15 tabs; Opservo gives one fleet view ranked by health, with the fix.
- Uptime Kuma, UptimeRobot, Better Stack: they tell you a site is down. Opservo tells you why.
Full comparisons, including where the other tools win: /compare
Put it on the server that scared you last.
One command, about 30 seconds, first insight in under 5 minutes.
$ curl -sSL https://api.getopservo.com/install.sh | sudo bashPrefer to try it alone first? Start free on 2 servers, no card.